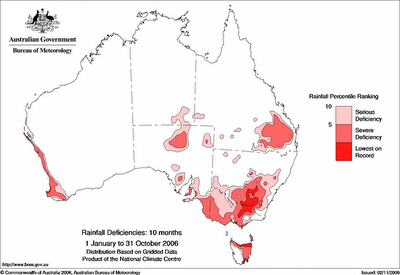
 It is worthwhile to look at the Australian Bureau of Meterology website for its discussions of the current drought.
 The map above shows rainfall for the 10 months to 30 October relative to historical experience. The dark red areas are areas where rainfall over this period is the lowest it has been in the period back to 1900, the fairly dark red areas show areas where rainfall falls in the lowest 5% of recorded levels over this period and the pink areas show areas falling into the lowest 10%. There is a serious drought situation over much of south-east Australia, the south-east corner of Queensland, the coastal strip in south western Western Australia and the north east part of Tasmania. Its a grim picture, particularly for Victoria.
There are other similar figures sjhowing the general drought picture for periods going back from 3 months to 3 years here.
The following shows the Bureau's estimated probabilities of rainfall exceeding median rainfall over the next 3 months. A figure less than 50% shows that there is more likely than not to be less than median rainfall.
 For the most part these figures - based for the most part on trends in ocean temperatures - are not very encouraging. The worst drought affected parts of Queensland, NSW and Victoria have a relatively poor expectation of short-term drought relief.


3 comments:
Harry, it's even worse than that. Those regions suffering the most severe drought are the areas that supply most of the Murray River's flow.
That said, summer rain isn't the biggie. Next year's autumn break is the really important one. If we don't get good rain in those areas in March or April next year, the Murray will be one long set of bogs and waterholes and Adelaide might be drinking seawater.
Harry with the image put width="90%" in the img tag
Also you haven't covered the heroic anarchist crusaders in Melbourne. What's going on?
rabee
Yeah, what Robert said. That big red patch over the mountains is really nasty.
Post a Comment